Take the guesswork out of understanding your school communities. This easy-to-use GIS tool displays socio-economic and demographic information (and more), allowing users to easily display, digest and disseminate data to a variety of audiences. It is an ideal tool for policy development and aids in understanding the needs of your schools and students.
ThemeMap


Features of our customized, turnkey system and services include:
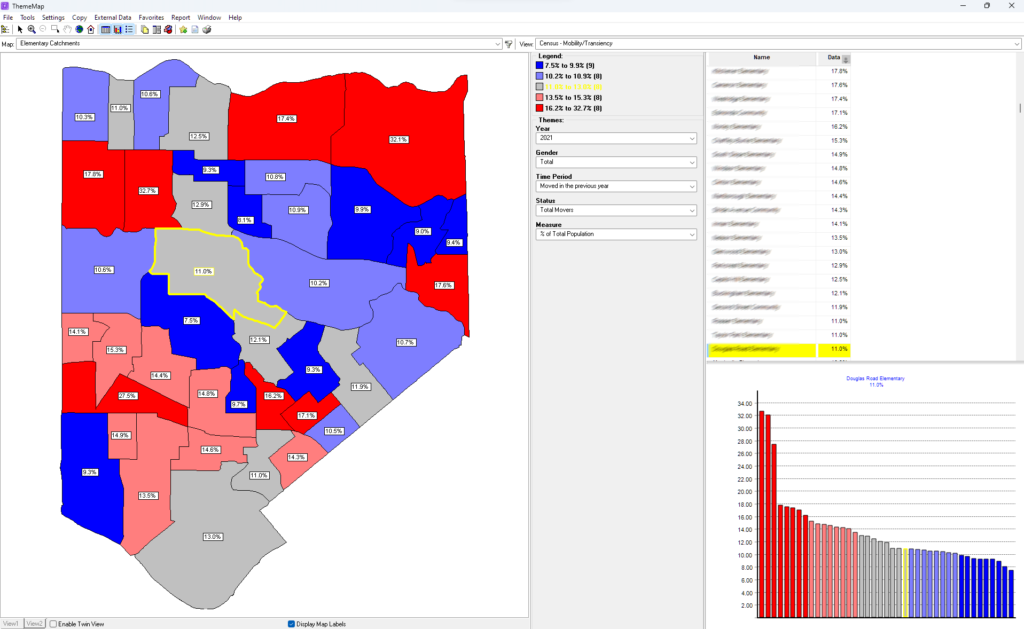
- Make a selection and the map instantly shades the school catchment areas based on the degree to which they meet the selected criteria, making visual analysis easy and impactful.
- Includes powerful reporting and presentation features.
- Provides the ability to visually correlate data.
- Identify schools with exemplary practices.
Unique Data Sources
- Custom-aggregated Census data and measures
- Includes data from Demographic Dynamics
- Includes data from GeoSchool/Student Information System
Powerful yet simplified analysis
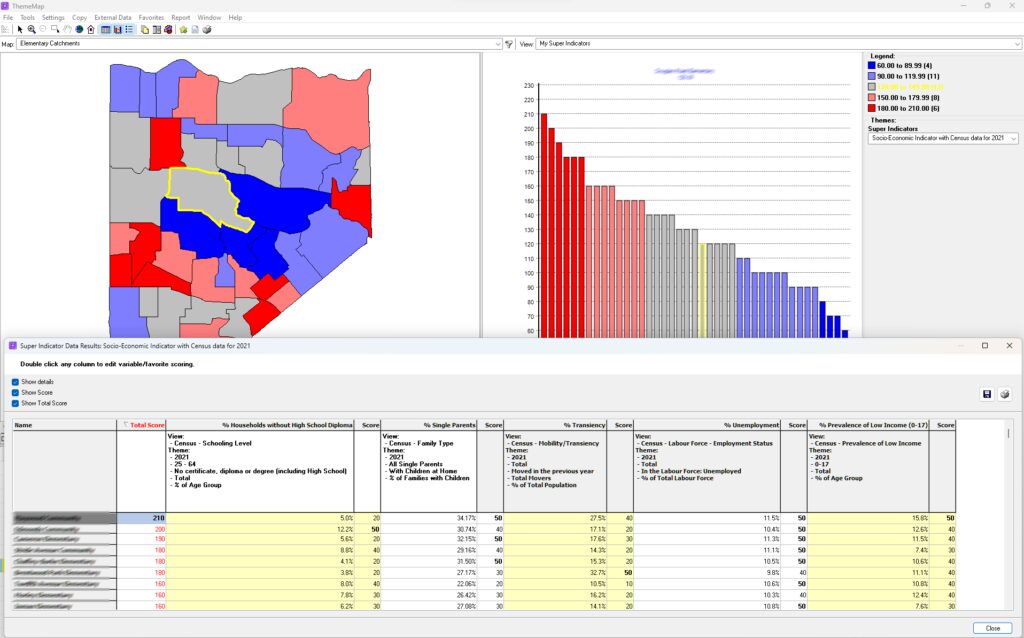
- Create ‘Super Indicators’ by weighting multiple variables.
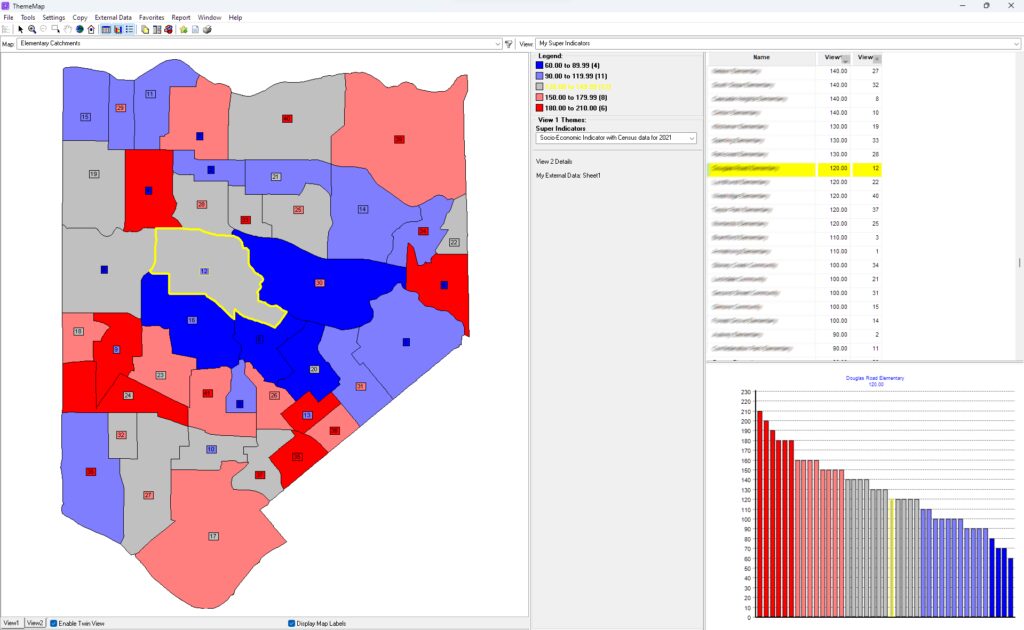
- Correlate data, such as student achievement vs. socio-economic indicators or student absenteeism.
- Easily add your own data for instant visual analysis
Why Baragar?
Personalized ongoing support
Our service doesn’t end once your annual software update is delivered. Need help or advice? We’re here for you.
Leverage accurate data
All good strategy begins with good data! Curating data from external sources is complicated and time-consuming – we do it all for you.
Experienced Staff
Team leads average 20+ years of experience at Baragar, with additional staff averaging 10+ years.
Move beyond reactive planning
Baragar’s software, data, and services highlight potential problems well in advance. Taking proactive action allows you to minimize the impact on students and families.